Impact 2025
The story behind the results.


Impact Can’t Wait
Today, over 534 million people in sub-Saharan Africa live in acute multidimensional poverty — with deep deficits in access to services like health care and education and declining living standards compounding one another. With one of the fastest-growing populations in the world, the number of people living in poverty in the region is rising — even as gains are made.
This isn’t just a challenge. It’s a call to action. One that demands smarter, faster, and more adaptive responses — especially for the most underserved last-mile communities living in ultra-poverty and facing the deepest and most compounding forms of poverty.
That’s why impact can’t wait — to build development programs that are rooted in evidence, designed for success and scale, and delivered with cost-efficiency and urgency.
When data and collaborations guide adaptive design and delivery, we can unlock solutions that match the scale of the need — in our lifetime.

About Raising The Village
Raising the Village (RTV) exists to build a world where last-mile communities can create a future beyond ultra-poverty.
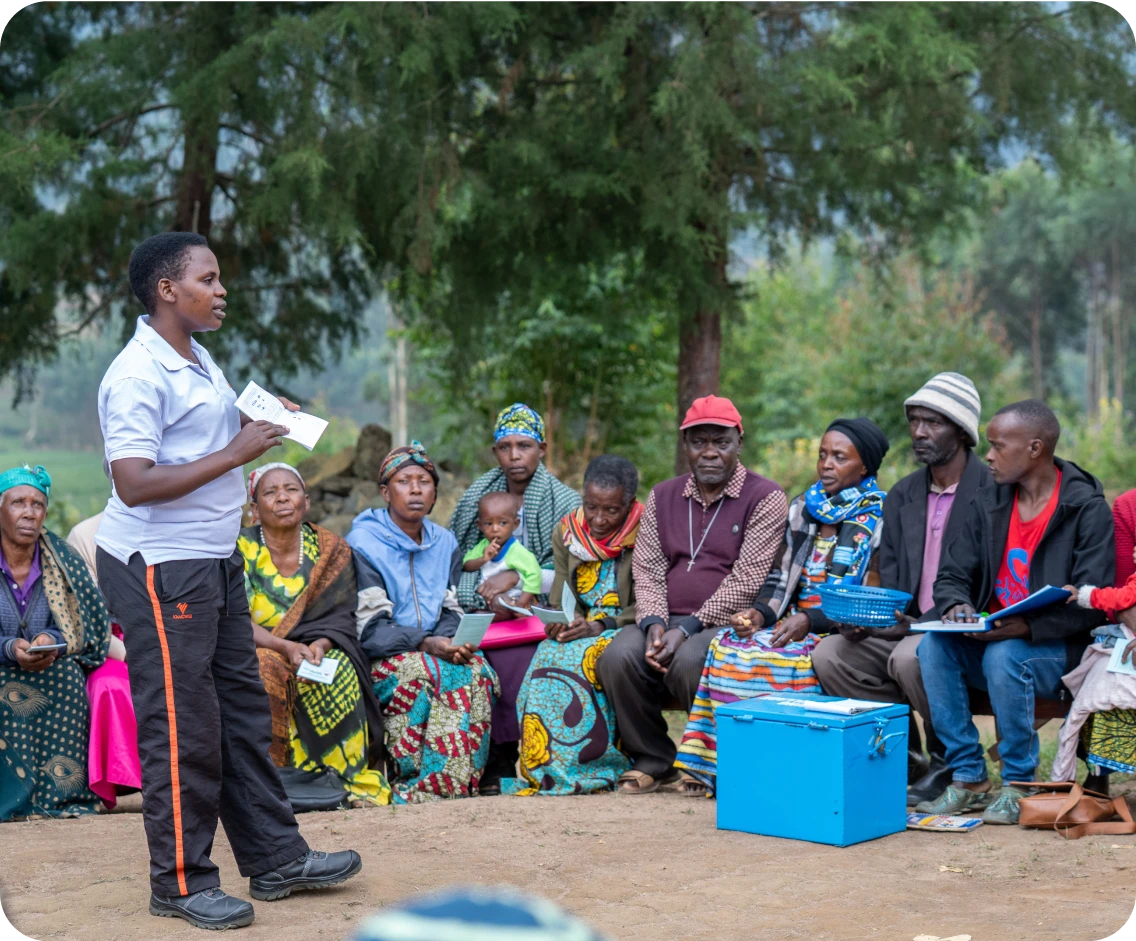
Ultra-poverty is complex, so we take a multi-dimensional approach to both program delivery and data-informed decision making.
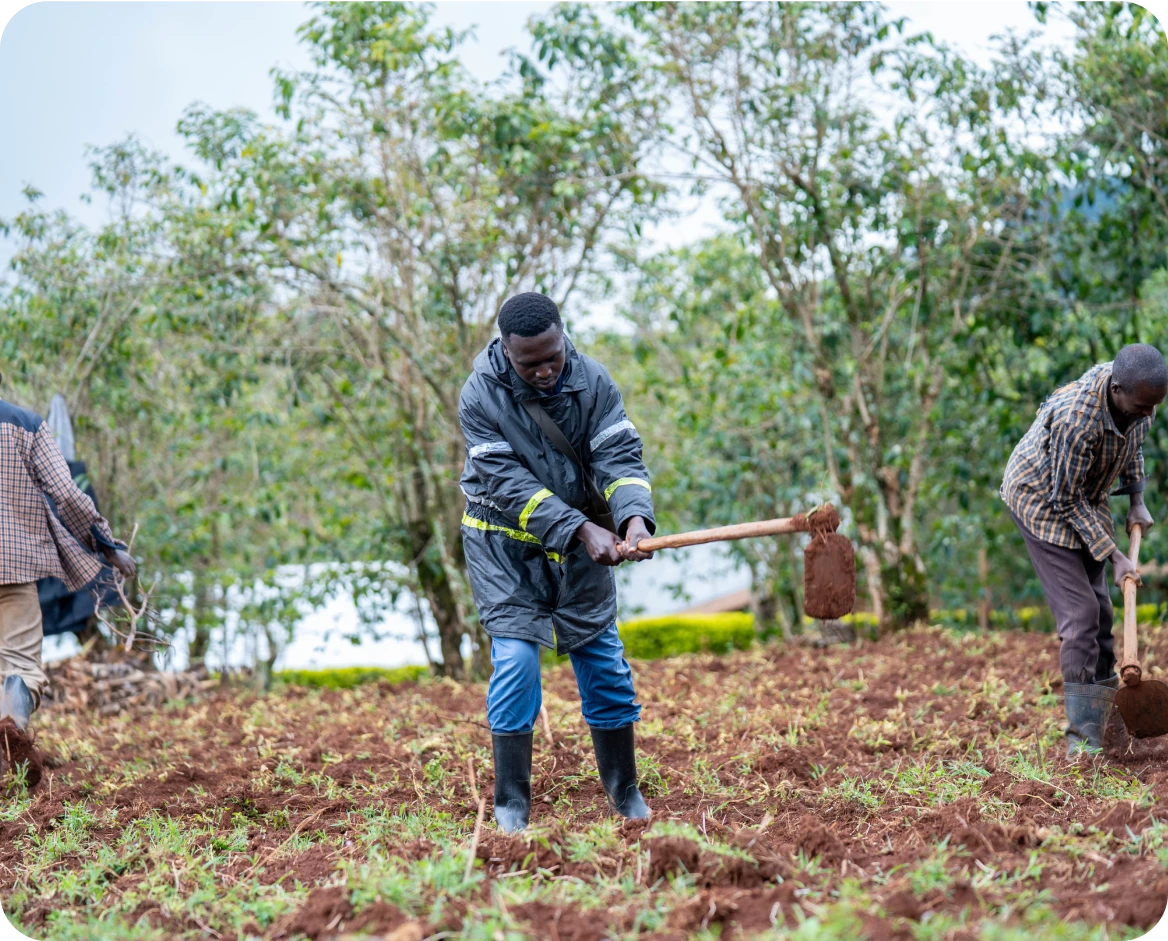
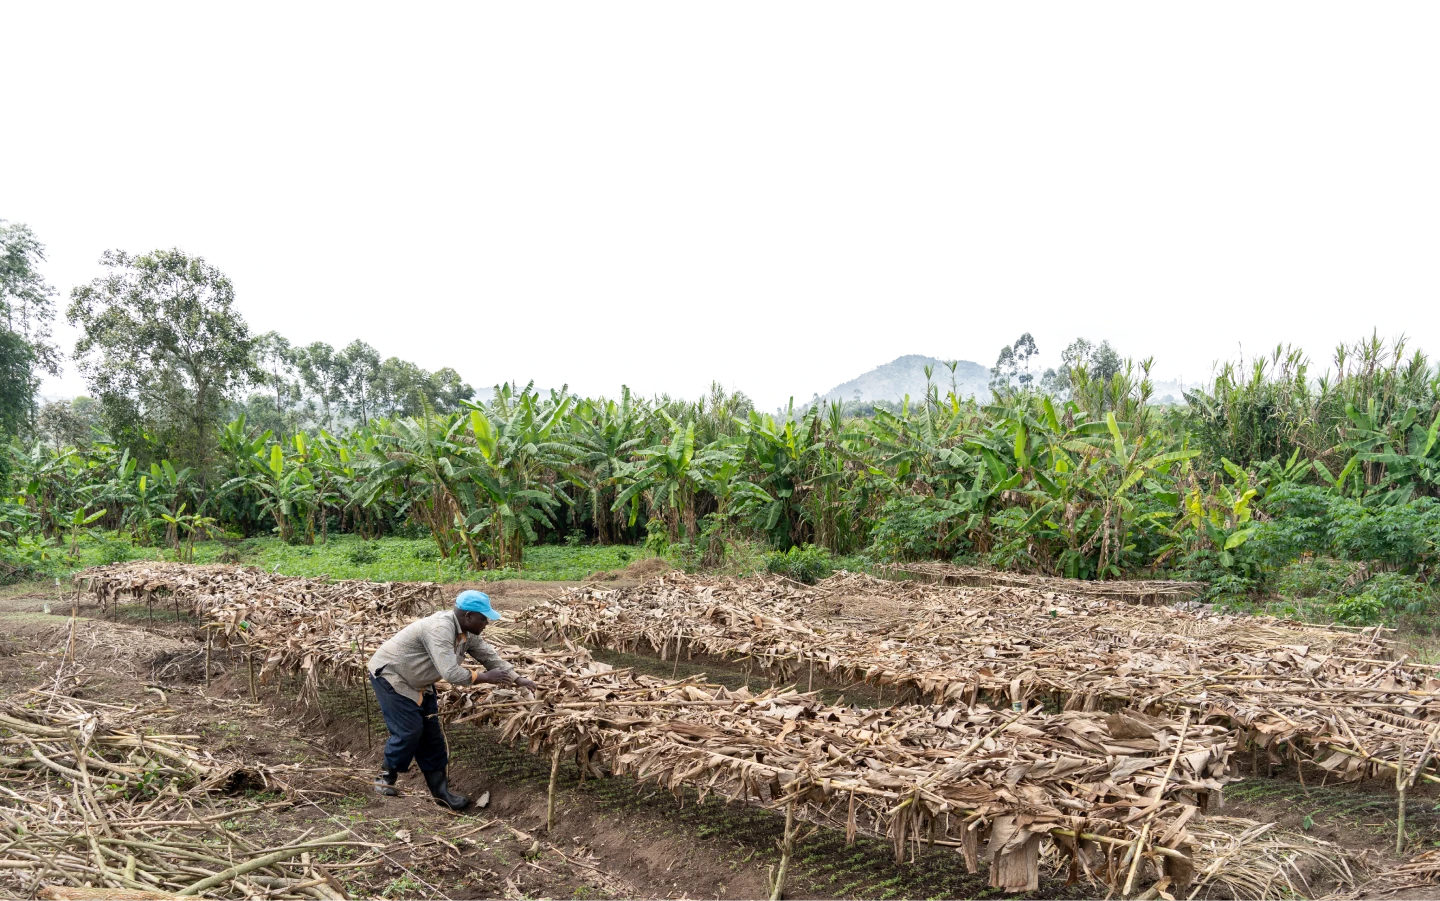
We work with clusters of 6–8 last-mile villages over 24 months to increase income and production through agriculture and diversified income streams. To drive participation and lasting change, we support communities with programs in food security, health, water, hygiene and sanitation (WASH), mindset change and financial inclusion. By fostering local ownership through village leadership structures and peer accountability, communities sustain and build on their progress long after graduation.
At the center of our program is Venn, our data and technology engine, which tracks the real-time progress of every household as the program unfolds. These insights help our teams adapt in real time and scale impact across critical dimensions of ultra-poverty, and help us continuously learn and innovate.
Our data‑informed and adaptive approach delivers measurable results and sector-leading Return on Investment (ROI) at a fraction of the cost of traditional programs.
Our Partner Communities
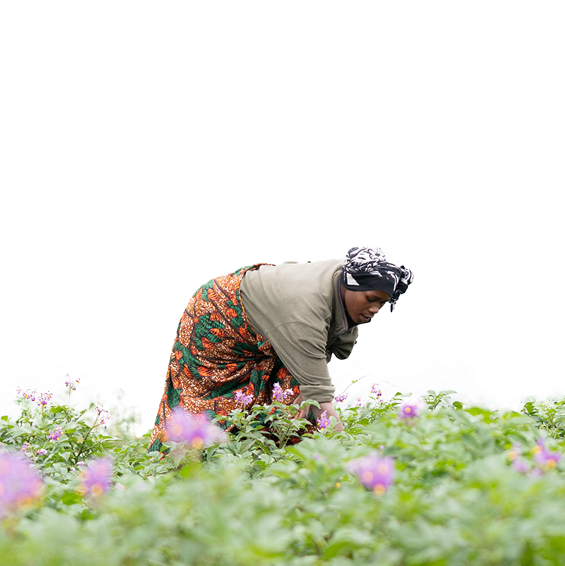
We partner with subsistence farming communities that are geographically, economically or socially isolated, often located in hard-to-reach areas.
These communities are gravely underserved, with limited access to infrastructure, essential services and economic opportunities.
Community Profile at Baseline - 2025 Graduating Cohort
Average baseline Household Income and Production
$0.65 per day
Average baseline Household Income and Production
(for the Lowest Income Group)
$0.45 per day
Median number of income sources
(per household)
2
Primary source of income and sustenance
Agriculture
Median land size
1 acre
Median time to reach outpatient health services
(one-way)
60 min
Median time to reach clean water
(one round-trip)
*Median of two round-trips per day
50 min
Median household size
5 people
Household head median age
43 years
About The Results
This digital snapshot of our impact report shares topline results from Raising The Village programs in Uganda, with a focus on the 2025 Graduating Cohort — villages that completed our 24-month program in 2025. You'll also see comparisons with earlier cohorts, including long-term results from the 2020 cohort at the 60-month mark since inception.
Progress is tracked through longitudinal annual household surveys, showing how partner households change over time. Impact is measured using a Difference-in-Differences (DiD) approach — a method that compares changes in RTV households with peer (control) communities to isolate the effect of our program. All figures are reported in USD and inflation-adjusted to 2017 values.
Key indicators include:

Household Income and Production (HHI+P), $
Household income from all sources and the value of household agriculture and livestock production (net of the agricultural and livestock income).
Program Value - $
The cumulative difference in Household Value (Household Income, Production, and Livestock Assets) between RTV and peer communities over time — showing the added value of our program.
Return on Investment (ROI) - %
The net program value gained by households compared to the cost of delivering the program.
Impact Efficiency - X
The total benefit per dollar invested, expressed as a return multiple indicating the value unlocked for every dollar spent.
This digital snapshot shares topline highlights and early emerging results from our programs in Uganda.
For a full view of the data, analysis, and context, please refer to the complete impact report when released.
Update: In June 2026, we updated some impact metrics to reflect corrections in currency conversions made since the last published report. These edits are minor and do not change the impact trends reported. The published 2025 Impact Report retains the originally reported figures.
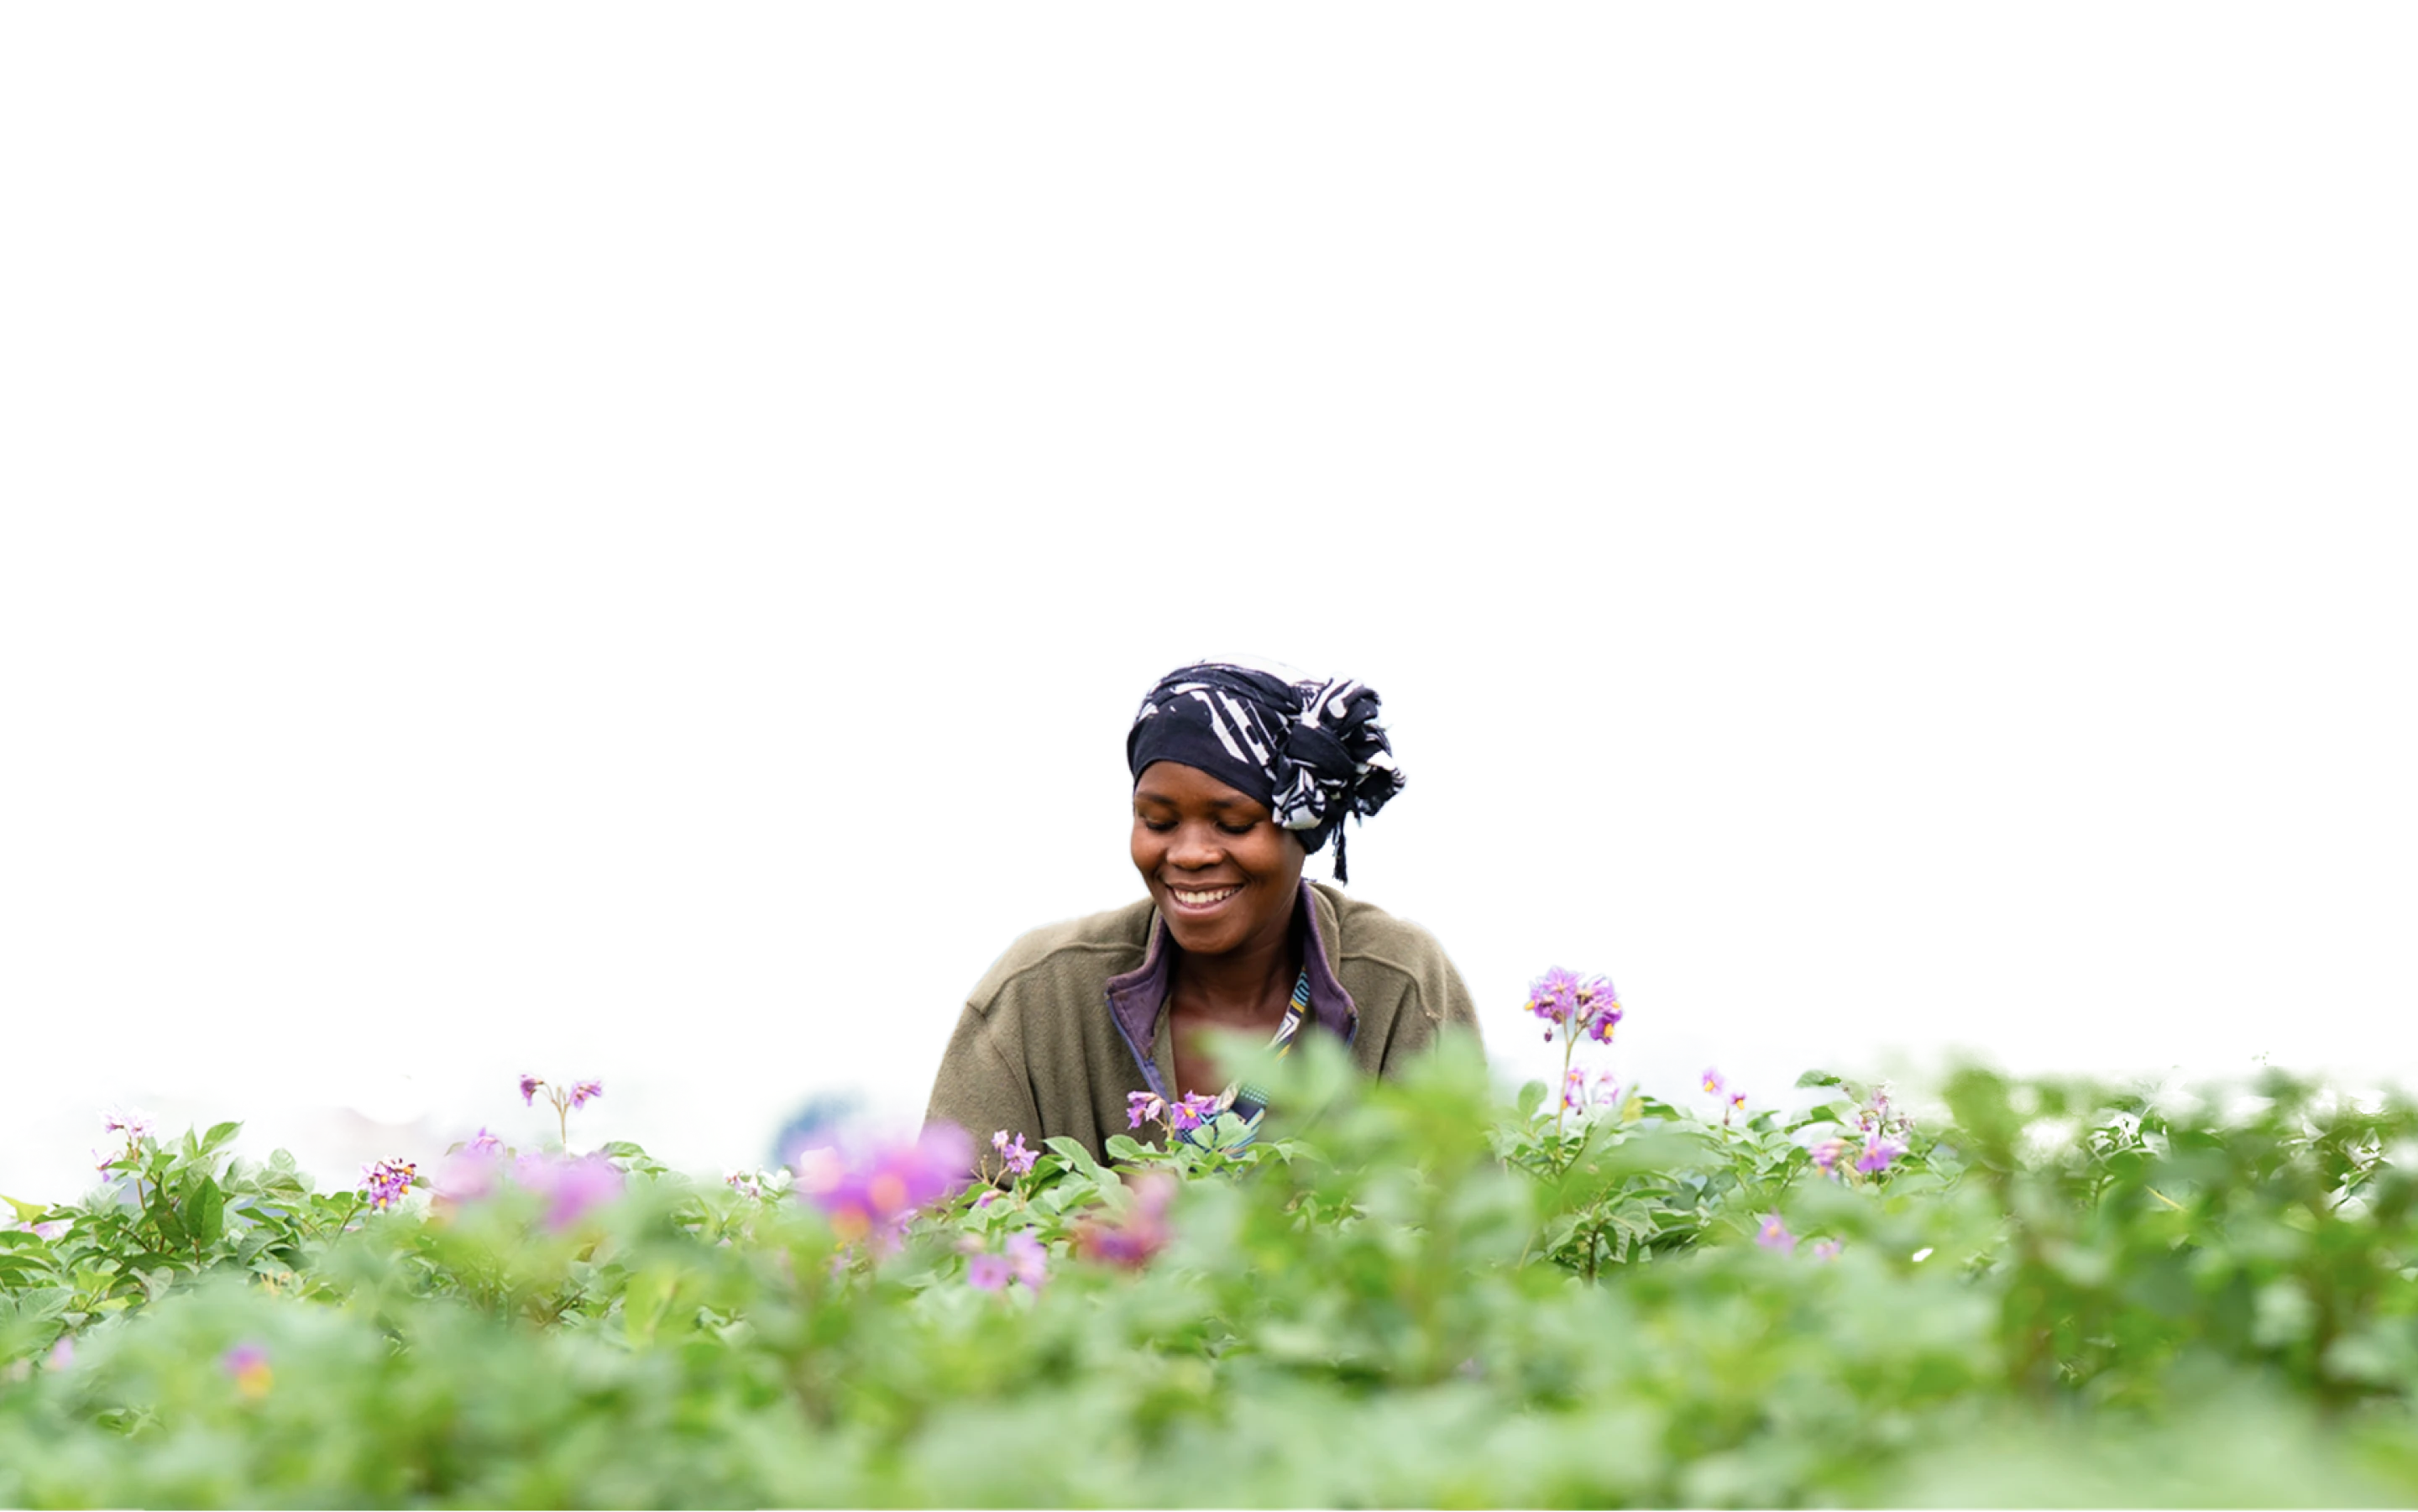
In two years, we’ve harvested more, bought land, and improved our home. Each season brings us closer to a better future.
Rebecca
Youth partner community member